
If you’ve ever onboarded Cloudflare logs into Microsoft Sentinel, you’ve probably used the official Cloudflare connector. It works, it’s well documented, and Cloudflare even refreshed it last October to move from the old Azure Functions design to a shiny new Codeless Connector Framework (CCF) implementation. So why would anyone build a custom one?
There are two reasons. First, the official connector still depends on CloudFlare Logpush, which is an Enterprise-plan feature. If you’re on Pro or Business, that path is closed to you. Second, even if you do have Enterprise, Logpush sends data through an Azure Blob Storage container as an intermediary, which means extra cost, an extra SAS token to rotate, and an extra moving part to monitor.
A few weeks ago I was working with a client who fits exactly that profile i.e. Business plan but they wanted their Cloudflare firewall events in Sentinel then we found out that Logpush, which is a feature that allows Sentinel integration is only available to enterprise plan only. That kicked off a side project that I think is worth sharing, because the resulting pattern works for any third-party REST or GraphQL API, not just Cloudflare.
In this post I’ll walk through how I built a code-less, Sentinel connector that pulls Cloudflare firewall events directly from the GraphQL Analytics API into a custom Log Analytics table and crucially, why this is useful for organisations that can’t or don’t want to use Logpush.
Use Case
The client uses Cloudflare to protect a handful of public-facing applications. They’re on the Business plan, which gives them WAF rules, managed rulesets, and rate limiting etc. but does not include Logpush. Their Sentinel deployment was getting all the relevant telemetry from Azure eco-system, on-prem and XDR etc. but the edge layer was a complete blind spot. Every time we wanted to correlate a back-end alert with a possible attack at the edge, someone had to log in to the Cloudflare dashboard and copy-paste data across.
The requirement was was simple i.e. get Cloudflare firewall events into Sentinel, near real time and without having to change their Cloudflare plan.
I could have used my custom log ingestion pipelines with bit of tweaking for cloudflare log schema
(If you you have’nt read my post about custom log ingestion,please check out my write up
Automating Custom Log Ingestion into Microsoft Sentinel with Azure DevOps)
but I decided to explore the new Codeless Connector Framework by Microsoft
Two Paths to Sentinel
Before getting into the build, it’s worth understanding why the official connector wasn’t an option, and why CCF is what makes the alternative possible.

The official Cloudflare connector relies on Logpush, which streams log batches to an Azure Blob Storage container that you create and manage. A separate CCF connector then reads from Blob into Sentinel. It’s robust and supports high-volume datasets like full HTTP request logs, but it requires Cloudflare Enterprise plan, and you end up paying for two storage layers (Blob plus Log Analytics) and managing SAS token rotation on top of that.
I chose my custom and alternative path i.e. the GraphQL Analytics API, which Cloudflare exposes to all paid plans (Pro and above). It’s the same API that powers the analytics graphs you see in the Cloudflare dashboard. With a few well-formed POST requests we can pull firewall events directly into Sentinel, without needing a Blob storage or Logpush that comes with Enterprise license.
The catch is that there’s no off-the-shelf connector that does this. We have to build it ourselves, which is where CCF comes in.
What is CCF?
CCF stands for Codeless Connector Framework. It’s Microsoft Sentinel’s declarative data ingestion system, instead of writing an Azure Function or Logic App, you describe how to call an API in JSON, and Sentinel’s built-in poller service does all the heavy lifting. It handles the HTTP calls, the response parsing, the ingestion routing, and the health monitoring.
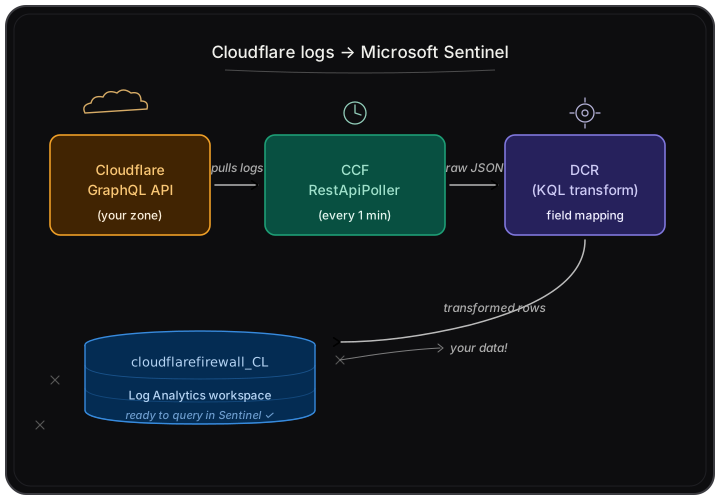
Every CCF pull connector has four building blocks:
- A custom Log Analytics table where the data will land after ingestion.
- A Data Collection Endpoint (DCE) and a Data Collection Rule (DCR) which transform fields and route data into the table
- A connector UI definition which renders the card you see in the Sentinel Data Connectors gallery
- A RestApiPoller which holds the actual polling configuration endpoint, auth, request body, response parsing
Once you understand these four pieces, you can build a connector for almost any API. The Cloudflare example below is just one application of the pattern.
Step 1: Test the Cloudflare API by Hand
First step is to confirm if the API is returning the data we need. Simplest way is to curl the API endpoint. I had the following ready for my testing:
- An API Token with
Account Analytics:ReadandZone Analytics:Readpermissions. Create one at My Profile → API Tokens → Create Custom Token in the Cloudflare dashboard. - Your Zone ID : a 32 character hex string visible on the Overview page of your domain in Cloudflare.
The GraphQL query for firewall events looks like this:
curl -X POST https://api.cloudflare.com/client/v4/graphql \
  -H "Authorization: Bearer YOUR_TOKEN" \
  -H "Content-Type: application/json" \
  -d '{
    "query": "{ viewer { zones(filter: { zoneTag: \"YOUR_ZONE_ID\" }) { firewallEventsAdaptive(filter: { datetime_geq: \"2026-05-01T00:00:00Z\", datetime_leq: \"2026-05-01T23:59:59Z\" }, limit: 10, orderBy: [datetime_DESC]) { action clientIP datetime ruleId } } } }"
  }'
If you get a response with a firewallEventsAdaptive array containing real events, you’re good to proceed. If you get an errors field, check the token permissions and the Zone ID first.
Step 2: Create the Infrastructure (DCE, DCR, Custom Table)
The custom table is where the data lands in Log Analytics. The DCR transforms the API field names into table column names. The DCE is the ingestion endpoint that CCF’s poller posts to.
I create all three resources in a single ARM template. The most important things to get right are:
- The streamDeclarations in the DCR must match the field names that Cloudflare actually returns
- The
datetimefield should be declared as astring(notdatetime) CCF’s stream coercion can silently drop records if Azure’s datetime parser doesn’t like the ISO-8601 format. The transform’stodatetime()handles the conversion safely - The
transformKqlusesextendrather thanprojectthis way if a field is missing from a particular record (some Cloudflare plan tiers omit certain fields), the row still lands with a null value instead of failing the entire transform
The transform I used looks like this:
source
| extend TimeGenerated = todatetime(['datetime'])
| extend Referer = clientRequestHTTPHost
| extend Url = clientRequestPath
| extend HttpUserAgent = userAgent
| extend HttpHost = clientRequestHTTPHost
| project-away ['datetime']
After deploying the infrastructure template, note down two values from the deployment outputs you’ll need them in the next step:
- The DCE Logs Ingestion URL (format:
https://<dce-name>-<id>.<region>.ingest.monitor.azure.com) - The DCR Immutable ID (format:
dcr-xxxxxxxxxxxxxxxxxxxxxxxxxxxxxxxx)
Step 3: Write the Connector Template
This is where the actual API polling configuration lives. Two resources are bundled into one template the UI definition (which makes the connector card appear in Sentinel) and the RestApiPoller (which does the work).
A few things that took me some trial and error to get right:
GraphQL requires HTTP POST with a JSON body. CCF defaults to GET. You have to explicitly set httpMethod to POST, isPostPayloadJson to true, and put the GraphQL query inside queryParametersTemplate as a JSON-encoded string. There is no body field in the CCF schema, anything you put there is silently ignored.
Embedding the Zone ID into the GraphQL query requires ARM’s concat() function. The catch is that concat() only accepts single-quoted string literals , double quotes inside concat trigger a deployment error. Inside the single-quoted strings, double quotes are just literal characters and need no escaping.
Time window placeholders are injected by CCF on every poll. Use {_QueryWindowStartTime} and {_QueryWindowEndTime} inside your query, and set queryTimeFormat to yyyy-MM-ddTHH:mm:ssZ so the values are formatted in ISO-8601 that Cloudflare understands.
The eventsJsonPaths is the JSONPath that extracts records from the API response. Cloudflare returns events nested under data.viewer.zones[0].firewallEventsAdaptive. Since I’m filtering by a single Zone ID, I use index [0] for the zones array and [*] for the events:
1
"eventsJsonPaths": ["$.data.viewer.zones[0].firewallEventsAdaptive[*]"]
Authentication uses CCF’s built-in API key flow with the Bearer prefix:
1
2
3
4
5
6
"auth": {
  "type": "APIKey",
  "ApiKey": "[parameters('cloudflareApiToken')]",
  "ApiKeyName": "Authorization",
  "ApiKeyIdentifier": "Bearer"
}
The cloudflareApiToken parameter is declared as a SecureString in the ARM template, so Azure masks it in the deploy form, never logs it, and never persists it in saved templates.
Step 4: Deploy
The deployment order matters:
- Deploy the infrastructure template first it creates the DCE, DCR, and custom table
- Grab the DCE URL and DCR Immutable ID from the deployment outputs
- Deploy the connector template pass in the DCE URL, DCR Immutable ID, the Cloudflare API token (masked input), and the Zone ID
Within a few minutes of the connector template deploying successfully, polling kicks off. The first batch of events should appear in the cloudflarefirewall_CL table within 5 to 30 minutes.
To validate this, I use a simple KQL query:
cloudflarefirewall_CL
| where TimeGenerated > ago(30m)
| sort by TimeGenerated desc
| take 10
If you see rows, it’s working. If after 30 minutes you see nothing, check SentinelHealth first that table will tell you exactly what went wrong:
SentinelHealth
| where TimeGenerated > ago(1h)
| where SentinelResourceName contains "Cloudflare"
| project TimeGenerated, Status, Description
| sort by TimeGenerated desc
Pagination and Data Loss
CCF polls in fixed time windows defined by queryWindowInMin. On each poll the connector asks for records in the window, and the next poll picks up where the previous one ended. Failed polls are retried in the next window, so windows don’t gap.
This works well for most zones, but there’s a limit of 1000 events per poll. If a single time window contains more than 1000 events, the newest 1000 are returned (because the query orders by datetime_DESC) and the older ones are silently dropped.
For my client’s zones, traffic is well under that threshold even with a 5-minute window. For busier zones I would set queryWindowInMin to 1, which sustains up to ~16 events per second before the cap kicks in. If you need to detect whether you’re hitting the cap, this KQL query is your friend:
cloudflarefirewall_CL
| where TimeGenerated > ago(7d)
| summarize EventCount = count() by bin(TimeGenerated, 1m)
| where EventCount >= 1000
Any rows here mean you should reduce the polling window further. CCF also supports more sophisticated pagination types (PersistentToken, NextPageToken, etc.) ,but for Cloudflare’s firewallEventsAdaptive dataset, time-window plus a small enough interval has been sufficient.
Who Will This Be Useful For?
This pattern is most useful for organisations that:
- Use Cloudflare on a Pro, Business, or any non-Enterprise plan and need their firewall events in Sentinel
- Want to avoid the cost and complexity of Logpush + Blob Storage even if Enterprise is available
- Need to selectively ingest specific Cloudflare datasets by writing a focused GraphQL query, you can pull just the fields you care about, which keeps Sentinel ingestion costs predictable
- Are building custom CCF connectors for other GraphQL APIs the same pattern (POST +
queryParametersTemplate+ JSONPath extraction) works for any GraphQL endpoint
It’s probably not the right approach if you’re an Enterprise customer who needs full HTTP request logging for forensics,Logpush is built for high-volume datasets and Microsoft’s official connector should remain the default there.
Wrapping Up
CCF unlocks a lot of flexibility once you understand the building blocks. The Cloudflare GraphQL example is a useful one because Cloudflare’s official connector path gates so much behind the Enterprise plan, but the same approach applies to any third-party REST or GraphQL API. If you have a service that has an HTTP-accessible API, returns JSON, and supports time-windowed queries, you can build a CCF connector for it in a few hours of work.
I’ve published the full ARM templates and documentation on GitHub, please feel free to fork, adapt, or contribute. The repo includes the infrastructure template (DCE + DCR + table), the connector template (UI definition + RestApiPoller), a deployment guide, and a troubleshooting guide covering the most common failure modes.
If you adapt this pattern for another data source, I’d love to hear about it.
Found this guide helpful? Share it with your team and don’t forget to bookmark it for reference.